I guess most people use Lighthouse or Google PageSpeed Insights to evaluate the performance speed of their website.
Looking green is nice, isn't it? But wait, stop for about 5 seconds. Is the index given by Lighthouse really accurate?
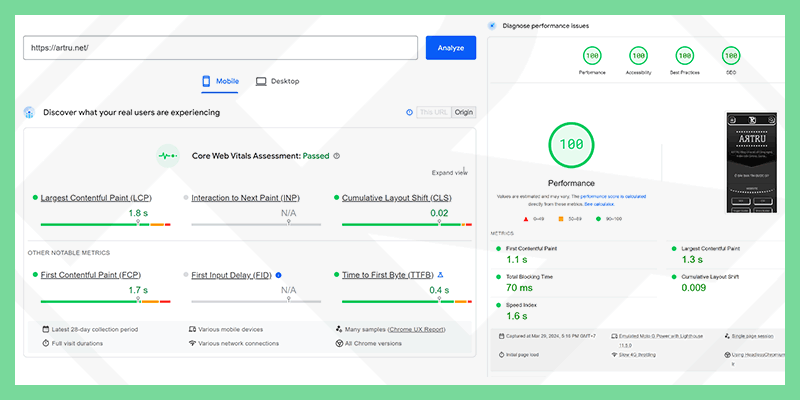
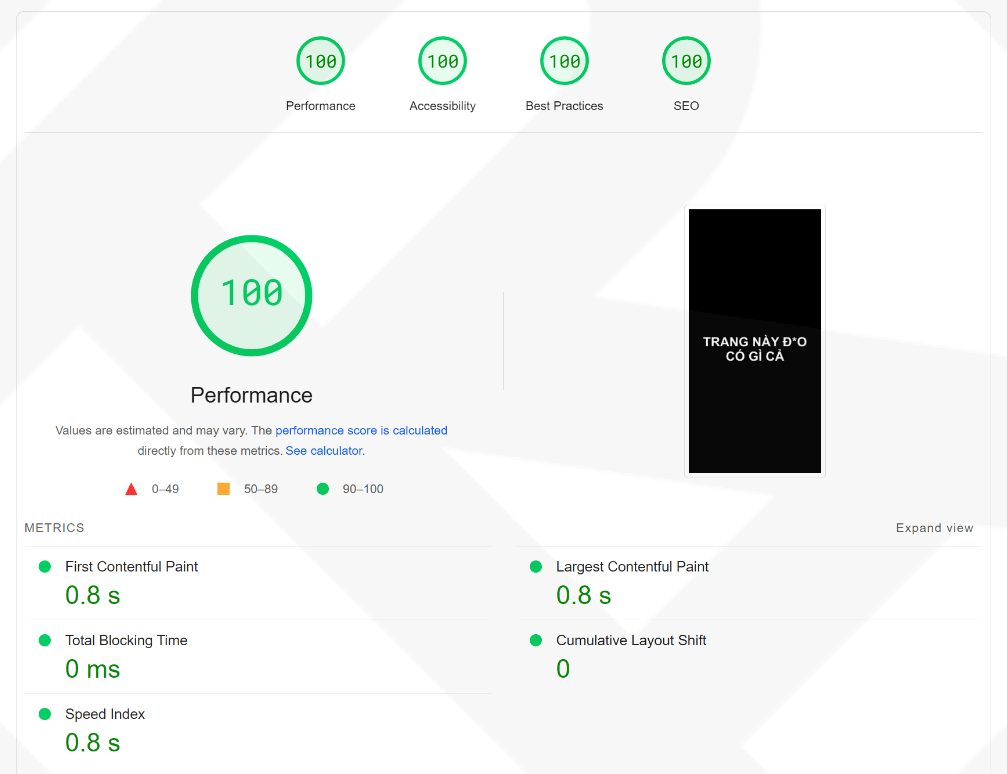
At the above website though there are scores 100 Absolutely but it's just a website without any content or images except a single line of text. So why do people rely on that score to judge that it affects SEO?
The next example that I measured shows the results of 2 websites FPTShop and Lazada. Do you think website number 1 or 2 is better?
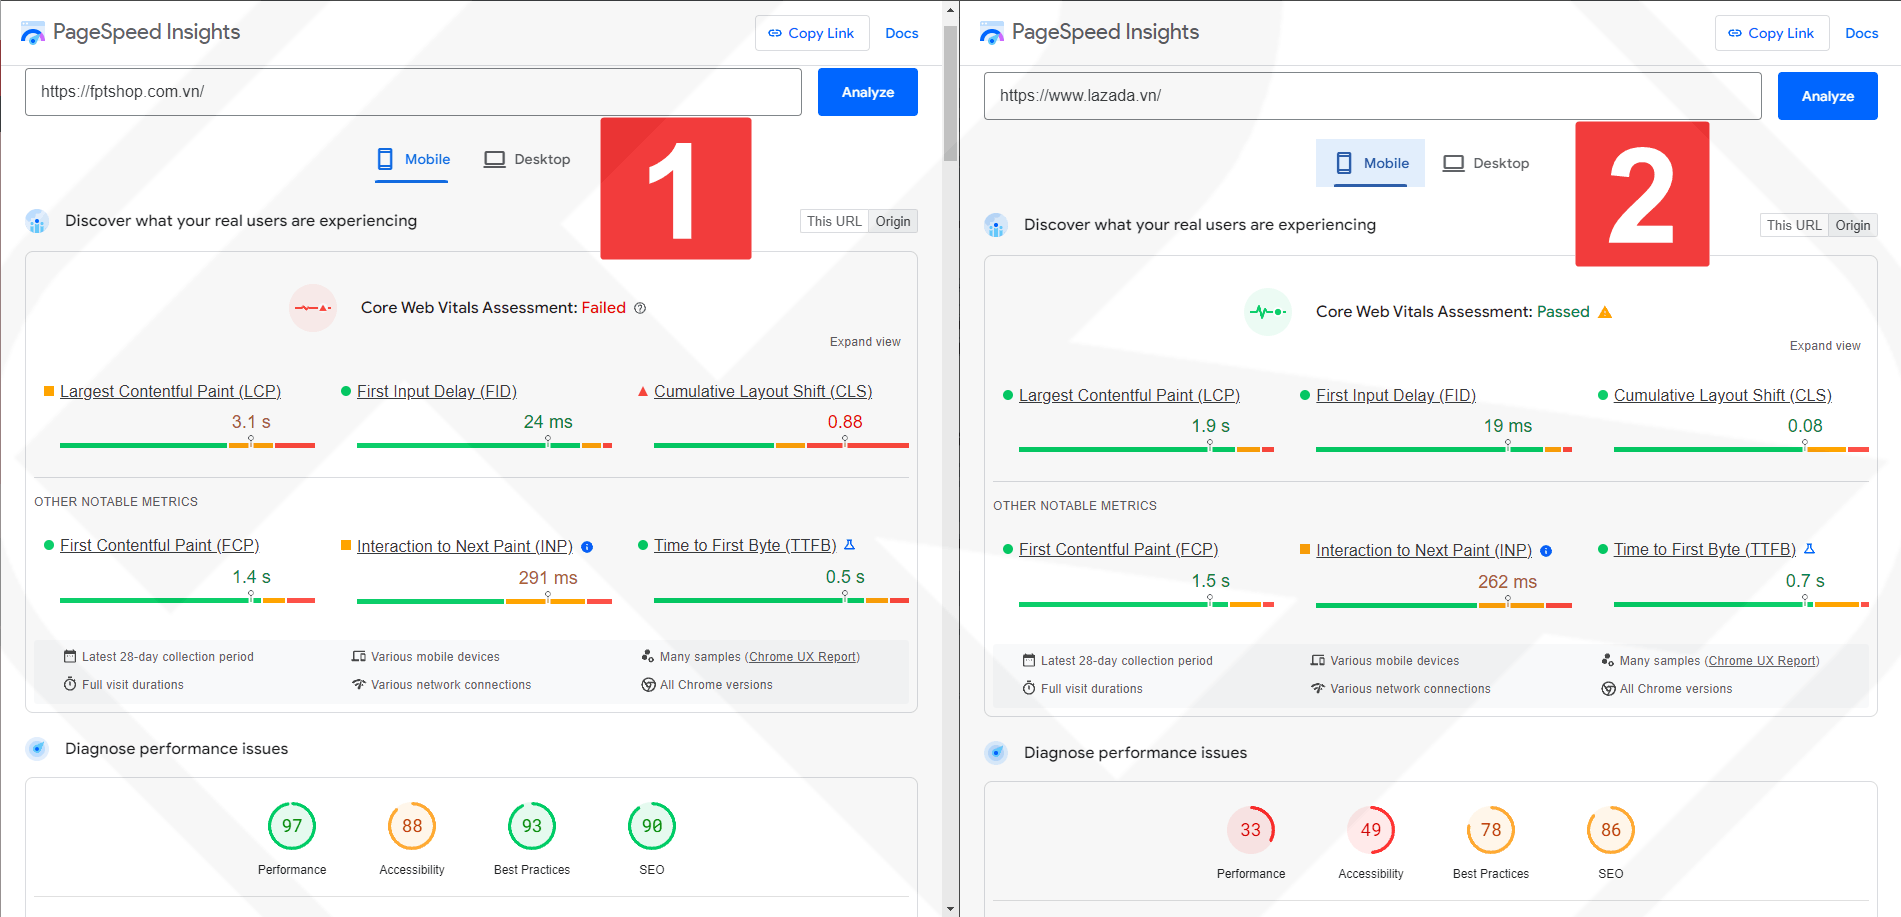
Although FPTShop's left web performance score is up to 97 points, Core Vitals is “Failed”. And Lazada only has 33 points “Passed” new or good.
In short, in my opinion, a low performance score does not mean the website is slow. But Core Vitals points “Failed” then the website is definitely having problems.
Since Google updated the Core Vitals index, the way to test website speed has also changed. I'm not sure my measurement method is 100% accurate, but in my personal opinion, it gives quite relative results.
Step 1: Download the Core Vitals utility
Instead of waiting for the amount of traffic to be large enough, parameters will appear on PageSpeed Insights. We can use a few utilities on the Chrome app store to proactively check Core Vitals scores.
Currently I am using these 2 utilities
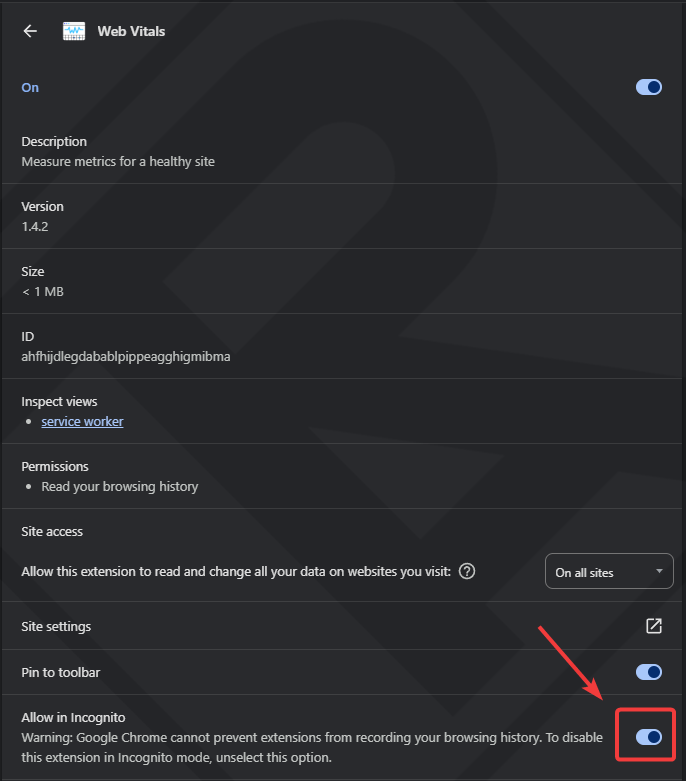
A quick note: make sure to enable the option for these two extensions to run in "incognito mode".
Step 2: Use Developer tools (F12)
Developer tools is a fairly powerful tool built into the Chrome browser. Here you can check Lighthouse directly without having to go to the PageSpeed Insights website.
Additionally, you can change the screen size to resemble the actual device. Or change network bandwidth parameters. Applying the two things mentioned above, I will customize both Mobile and Desktop devices to look like a bot that PageSpeed Insights is using.
Customize 2 screen sizes for Mobile and Desktop
At the Developer tools interface, click on the icon Toggle device toolbar or press the keyboard shortcut Ctrl+Shift+M to open the device screen size customization toolbar.
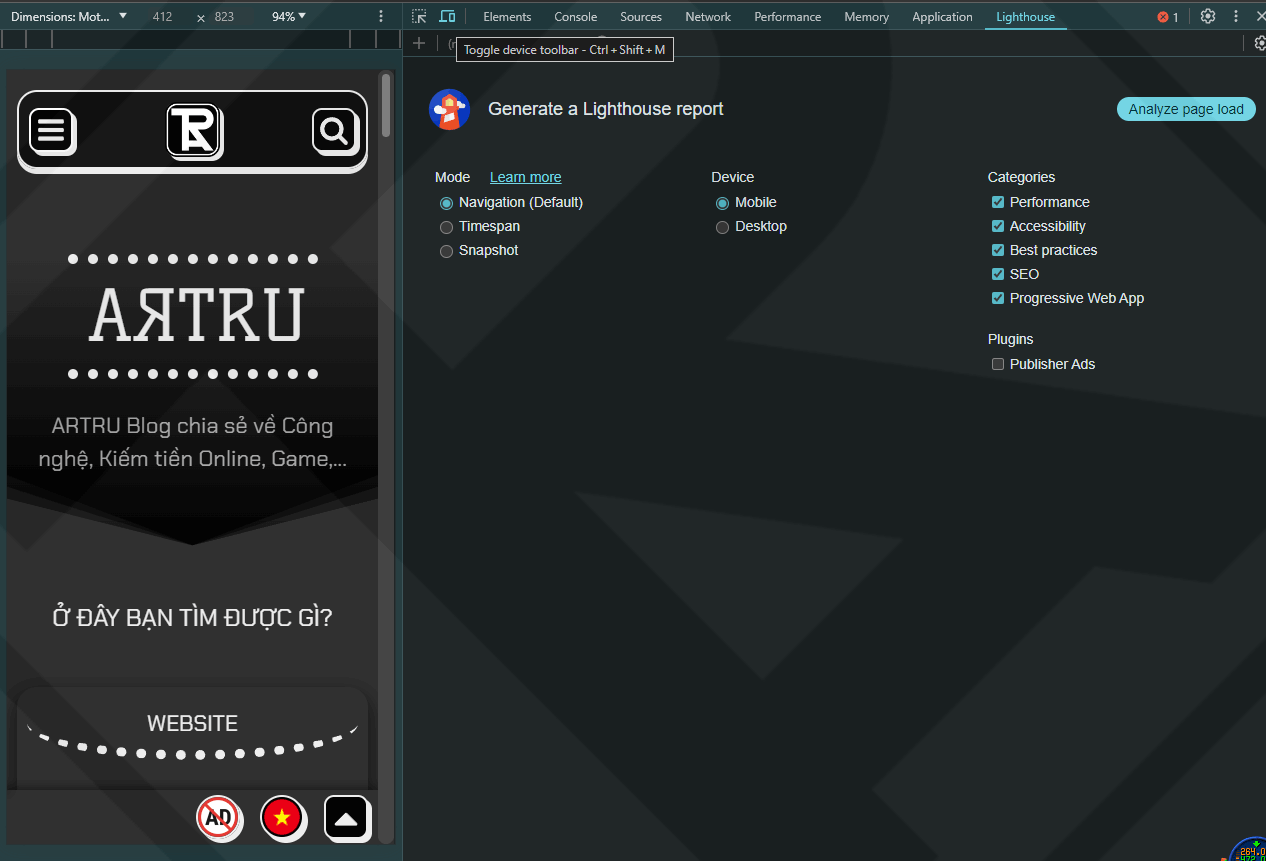
Click on the bar Dimensions → Edit
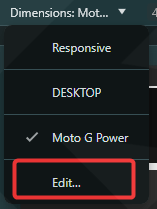
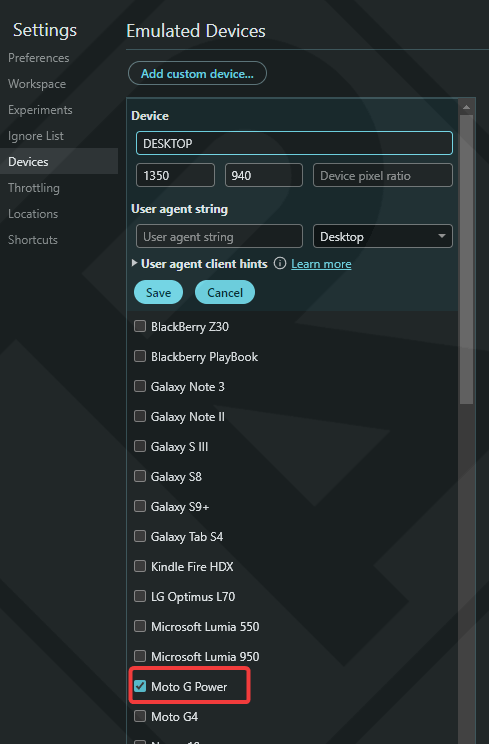
Find and check the box Moto G Power to set up for Mobile screen.
Click the button Add custom device → Fill in the device name Desktop → Enter screen dimensions in the ratio 1350×940 → item User agent string select Desktop → then press Save.
Customize network speed for Mobile and Desktop
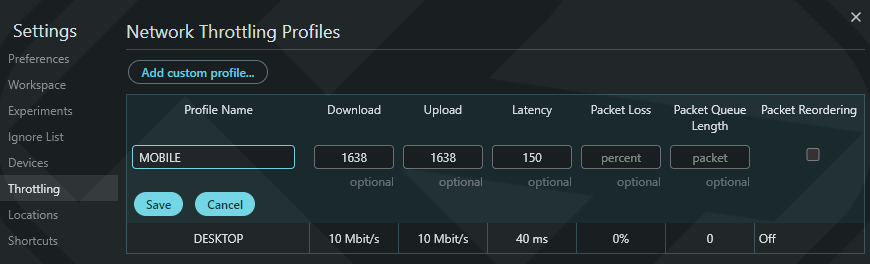
Also on the Developer tools interface, click on the item Network in the top bar → click No throttling → Add → Add custom profile...
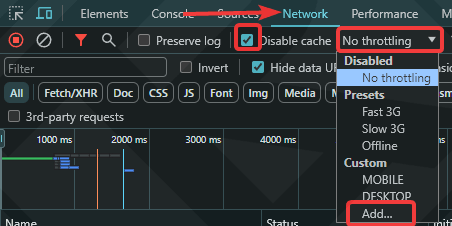
MOBILE download: 1638 kbit/s, Upload: 1638 kbit/s, Latency: 150ms
DESKTOP download: 10240 kbit/s, Upload: 10240 kbit/s, Latency: 40ms
At this step, you will wonder where you got the size and network speed parameters. Then my answer is from the PageSpeed Insights tool itself. It's here:
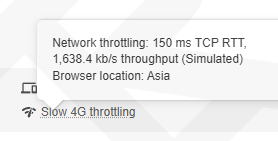
These parameters will certainly change in the future, so you need to update according to Google to get the most accurate results.
Step 3: Check parameters
To bring the most accurate results, I will divide into 2 cases: Mobile and Desktop. Based on the parameters set above, we will choose to synchronize according to each separate device type.
- Open an incognito tab to test the website like a real user.
- Choose Mobile + network screen size, also from Mobile. Similar setup for Desktop case.
- Once setup is complete, you can visit the website to see how your website actually loads.
- If the utility installed in step 1 appears green, your website has met the requirements.
In addition, you also need to check your load time DOMContentLoaded and Load at the bottom. I don't know what this parameter is. I usually take 3 seconds as the standard, however if the website contains large images or a complex layout it will definitely take longer, as long as it's not too long.
So will PageSpeed Insights be abandoned now? No, although it cannot measure website loading speed, it can tell you where the website is having errors. Combining both PageSpeed Insights and Core Vitals helps you overcome loading speed problems without affecting user experience.


Comment